
When I dove into optimizing my first Unity game years ago, there were plenty of resources that explained what I should optimize, but nothing really about the how to identify problems. Sure, the obvious first symptom is usually a jittery FPS, but that only clues you into the problem exists. How do you determine the root problem?
Getting a baseline
The first thing I do is make a development build for the device in question and get the Unity profiler connected. It's important to profile on device (desktop, phone, console, etc) and not in the editor. While there's some situations where you'd benefit from the quick iteration of profiling the editor, there are often too many caveats that will make it harder to real problems.
If I have a specific area that I'm trying to troubleshoot, I'll run thru the repro conditions with the profiler connected. Otherwise if I'm just doing some exploratory testing, then I'll just capture a few seconds of the core gameplay.
Unity's profiler window defaults to capturing a max of 300 samples, but you can increase this up to 2000 frames. Just keep in mind that more samples means larger snapshots.
Then a very important step: I save the snapshot the disk so I can always refer back to it as a baseline. Without it, I have no quantifiable way to determine how much impact my optimizations are making. Eyeballing FPS counters only gets you so far.
I also find it useful to record another snapshot with deep profiling enabled. I usually capture a shorter period of time, primarily because Unity starts to slow down with large deep profiling snapshots. Your mileage may vary depending on your system specs and project size/complexity.
Analyzing the data
Once I've gather my baseline snap shots, I load up the snapshot with deep profiling disabled. Using the timeline view I can get a high-level view of where the game is spending the most time.
There's two main categories of markers you'll see: script update and rendering markers.
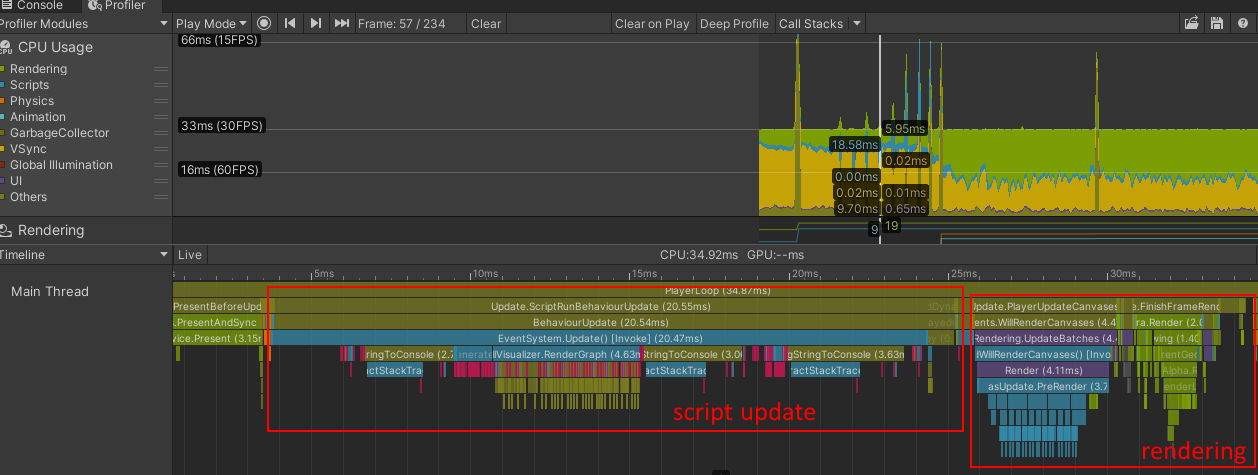
There's no best balance of these two categories and depends heavily on the game. Something leaning more heavily into visual effects will spend more time rendering, where as something learning more into simulation will spend more time in script updates.
More time spent in BehaviorUpdate usually means I'll be poking around in scripts, while more time in FinishFrameRendering markers means I'm poking around in shaders and adjusting materials.
By default, Unity gives you a very shallow view into your game, so at this point I usually flip to the snapshot with deep profiling enabled.
Its important to note that deep profiling looks at everything and will further degrade the performance of your game. Don't concern yourself with the exact milliseconds but rather the relative amount of time a functions takes in respect to the total frame time.